analyzing an RPG World as a Graph
May 22, 2020
For those of you that don’t know me, I have a lot of weird hobbies, one of those is playing a nearly 30 year old text-based Role Playing Game (RPG). Archaic by most gamer’s standards, the world is vastly different than most games, instead of being defined as an open map or grid, it is actually a directed graph.
A Little Background
The entirety of the graph is the World and the smallest component or node is known as a Room. Each Room belongs to a subgraph of known as a Location and each Location belongs to another subgraph known as a Realm. The entire Graph is currently crawled by a crowd-sourced mapping system, which more or less acts like a Wiki for this Graph. The graph is influenced by world events, and rooms can disappear, reappear, or generally change state, such as their cost function to traverse, without warning due to world events. As with any crowd-sourcing there are data integrity issues and we wanted to visualize where bad Location data currently exists in the World and attempt to perhaps autocorrect some of it using a more modern approach.
First Hurdle - Translating the Data Structures
Currently the World is stored in what most people might find to be odd format unless you have a lot of Ruby experience, this format is known as Marshal. I won’t go into all the quirks, but the general idea is this provides a programmer a way to export a raw Ruby Object to a byte stream and be reconstituted in another process which has some advantages and disadvantages. Analyzing it required writing a a couple small shims enabling me to serialize the data from disk outside of the context of the gaming engine that powers most scripting.
First Take
The first take was terrible, I had totally underestimated how gnarly the graph actually was after 30 years. It has dozens of orphaned Location definitions from areas that had been destroyed during world events, but are still maintained in the database. I had to prune the graph to something reasonable, which really just came down to a few rules.
valid_rooms = rooms.select {|r|
  r.location.is_a?(String) and       # non-string bad
  !r.location.empty? and             # empty string bad
  r.location !~ /, (outside|inside)/ # unreachable areas
}
This gave me a first step towards a reasonable graph, the next steph was transforming the data into the structure we cared to analyze, a list of rooms isn’t what we want, we can them organized by Location. Luckily in Ruby there is a handy Enumerable#group_by method.
# Hash of LocationName => Array(Room)
rooms_by_location = valid_rooms.group_by(&:location)
The next step we wanted to apply was finding the rooms in the location that connect us to another location, we care about the edges of the subgraph (Location) not all rooms in any location
# a little lambda to keep it readable
is_on_boundary? -> room {
  room.edges.any? do |edge| edge.location != room.location end
}
# Hash of LocationName => Array(BoundaryRoom)
location_and_boundaries = rooms_by_location.map do |location, rooms|
  {   location: location,
    boundaries: rooms.select do |room| is_on_boundary?.(room) end
  }
end
It turned out there were still a lot of orphaned locations where their boundary edges were empty, so I had to apply another filter to prune them.
non_orpaned_locations = location_and_boundaries.reject { |location|
  location[:boundaries].empty?
}
Now, we have something we can maybe, actually vizualize? I started into looking at what libaries were out there, and found the graphviz library which had ruby bindings, so I figured I’d give it a shot.
First, I needed to translate my graph objects into what graphviz expects:
viz = GraphViz.new(:G, :type => :digraph)
graph.each {|location| viz.add_node(location[:location])}
graph.each do |location|
  location[:boundaries].keys.each { |boundary|
    viz.add_edges(location[:location], boundary)
  }
end
viz.output(png: "locations.png")
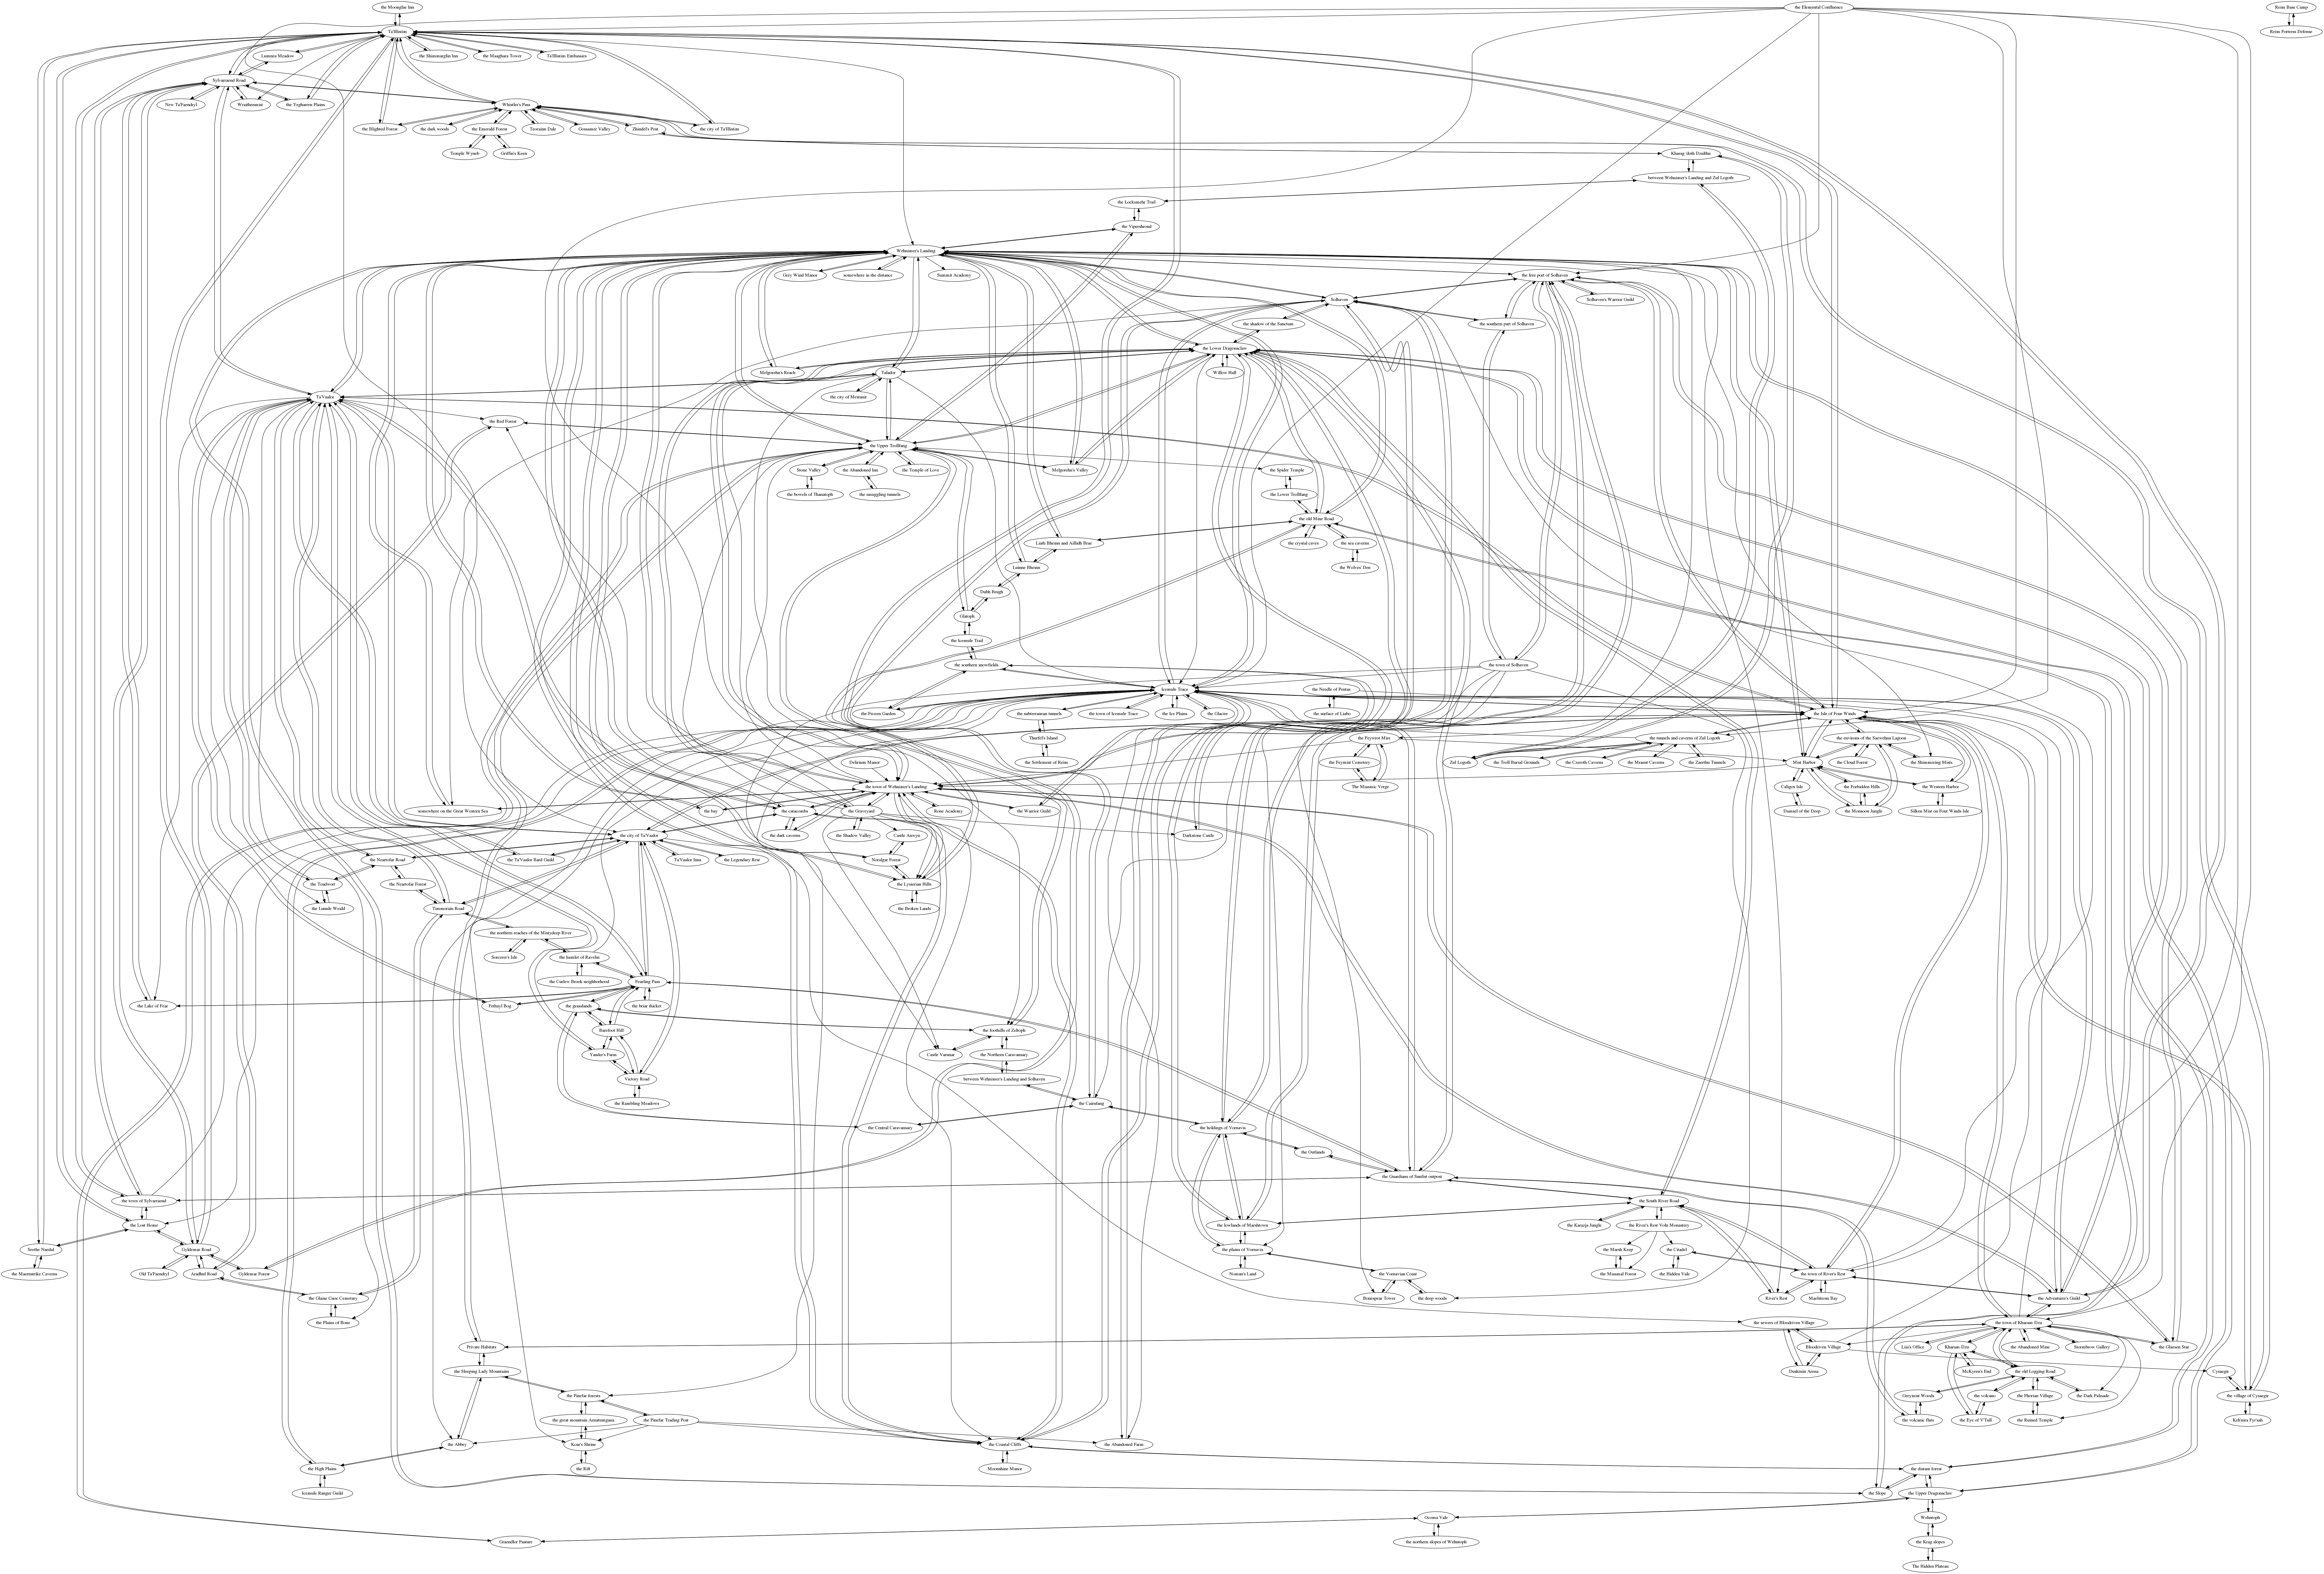
Which gave me this lovely output:

Clearly I needed a different strategy because this vizualization was not very useful for vizualising much of anything, and that’s when I went to bed.